
As Australia’s largest regional university, Charles Sturt is committed to improving access to higher education and supporting the success of students from diverse and disadvantaged backgrounds.
On this page you'll find insights into domestic undergraduate admissions, enrolments and completions by the equity groups recognised across Australian higher education.
In this context, equity students are students who belong to at least one of the following groups – Low SES, Students from Regional or Remote Locations, Students with Disability and First Nations Australian Students.
We track student progress from admission through to graduation. These insights help us develop enabling and transition programs and services that support student success.
The charts below are a summary of the proportion of Charles Sturt students in key equity groups at various stages of the student lifecycle.
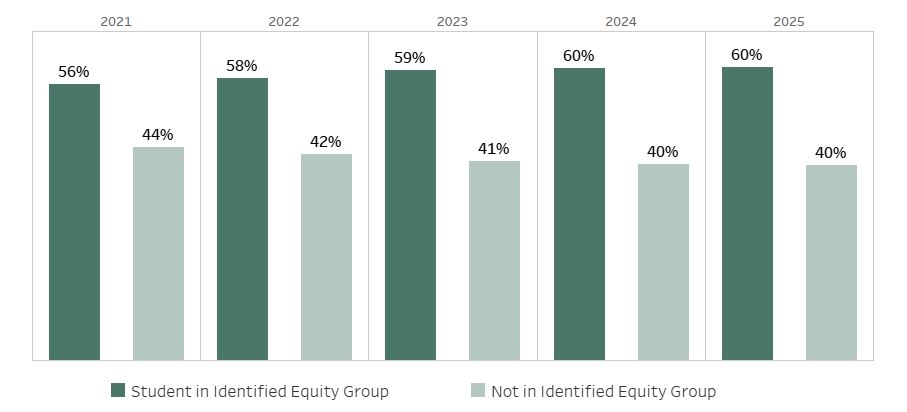
The Headcount for Students in Equity Groups shows the yearly proportion of domestic undergraduate students who belong to one or more key equity groups. These groups include students that are from low socioeconomic locations, from regional and remote locations, identify as First Nations, or have a disability.
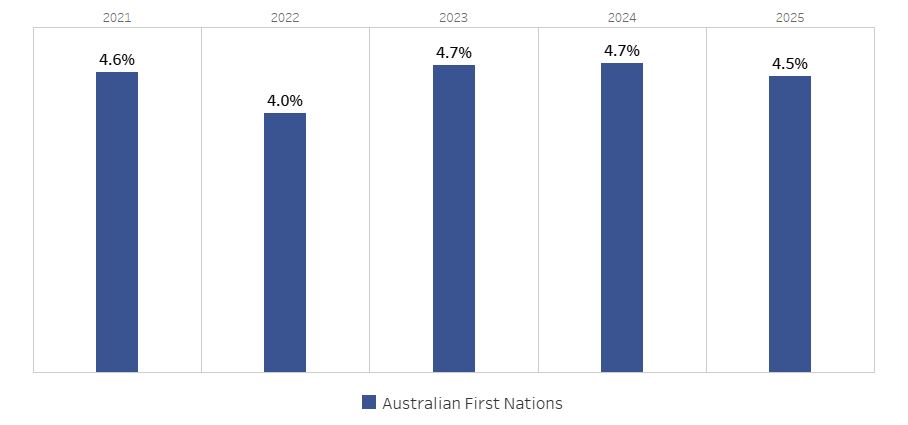
The Offers Sent by Applicant First Nations Status chart shows the yearly count of domestic undergraduate First Nations applicants who received an offer as a proportion of domestic undergraduate offers sent.
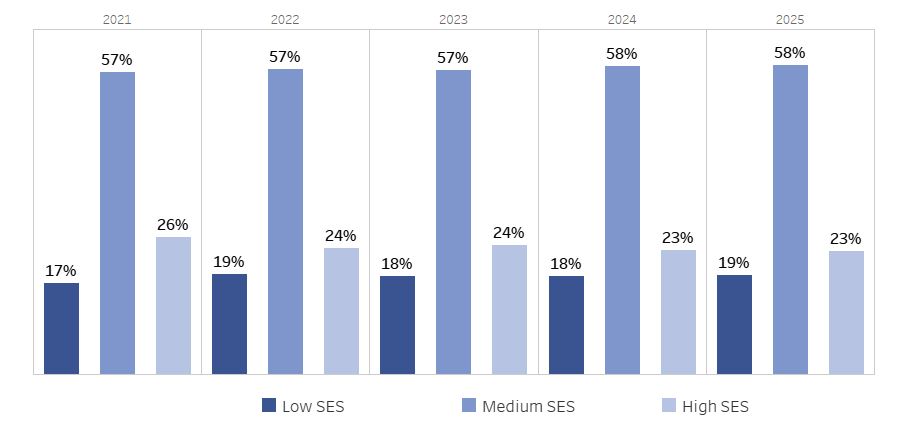
The Offers Sent by Applicant Socio-Economic Status (SES) chart shows the yearly proportion of domestic undergraduate applicants classified as Low SES, Medium SES, or High SES. Our SES data, based on postcode information, provides valuable insights but does not fully capture the number of Low SES applicants as accurately as the government’s street-level methodology. As a result, this chart currently underrepresents the true number of Low SES applicants.
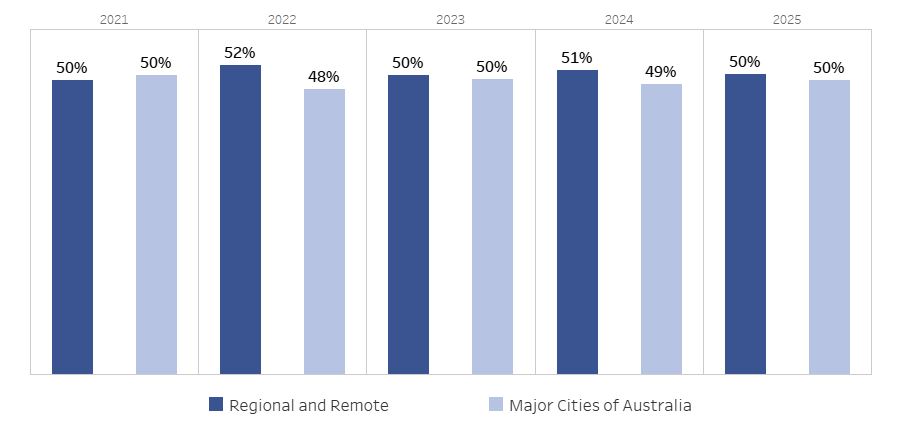
The Offers Sent by Applicant Location chart shows the yearly proportion of domestic undergraduate applicants that received offers in Regional/Remote Locations or Major Cities of Australia. Location information is based on the applicant's reported residential address.
Most Recent Sector Average is not available for admissions products, as admissions information is not included in sector-wide data releases.
The Commencing Headcount by Student First Nations Status chart shows the yearly count of domestic undergraduate First Nations Students as a proportion of commencing domestic undergraduate students.
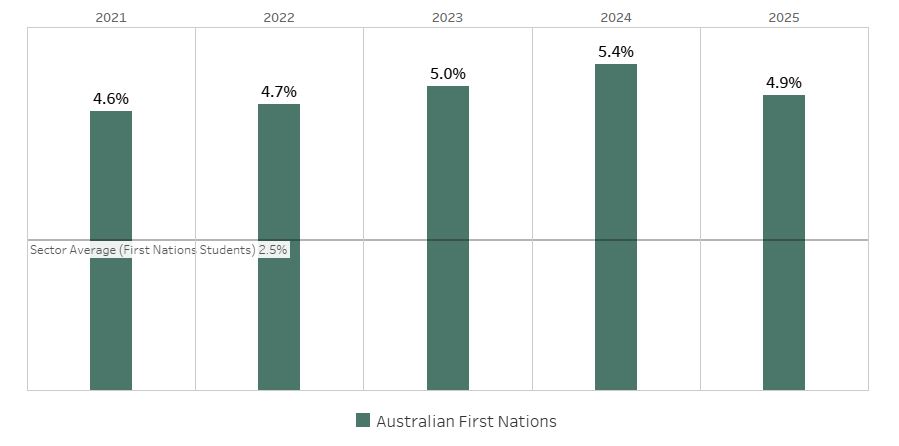
2024 Sector Average (First Nations Students): 2.5%
The Commencing Headcount by Student Socio-Economic Status (SES) chart shows the yearly proportion of domestic undergraduate students classified as Low SES, Medium SES, or High SES. Our SES data, based on postcode information, provides valuable insights but does not fully capture the number of Low SES students as accurately as the government’s street-level methodology. As a result, this chart uses national headcount data to demonstrate the University's Low SES cohort using the same methodology.
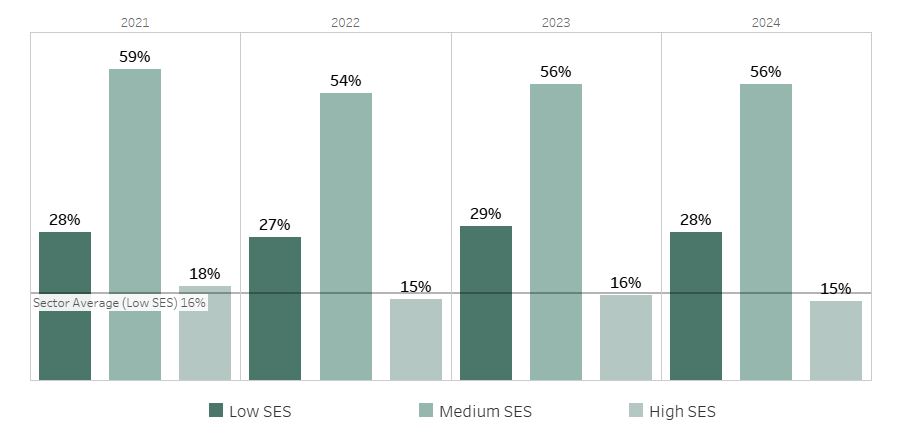
2024 Sector Average (Low SES): 16%
The Commencing Headcount by Student Location chart shows the yearly proportion of commencing domestic undergraduate students in Regional/Remote Locations or Major Cities of Australia. Location information is based on the student's reported residential address.
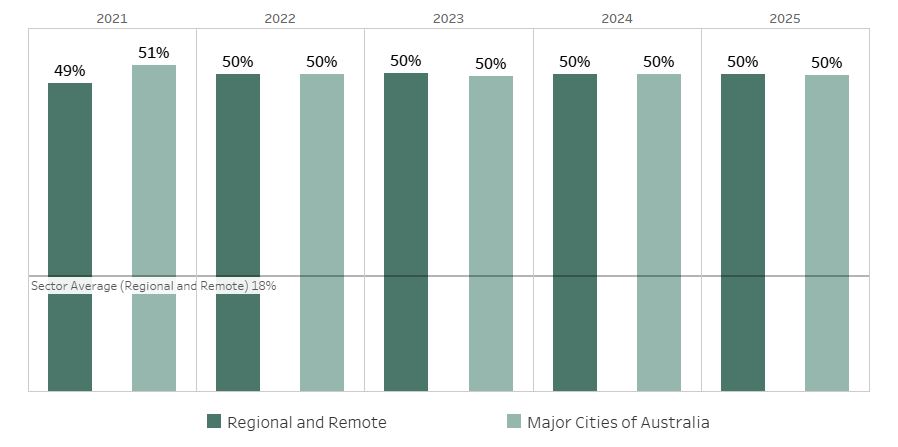
2024 Sector Average (Regional and Remote): 18%
The Commencing Headcount by Student Disability Status chart shows the yearly proportion of commencing domestic undergraduate students with a reported disability.
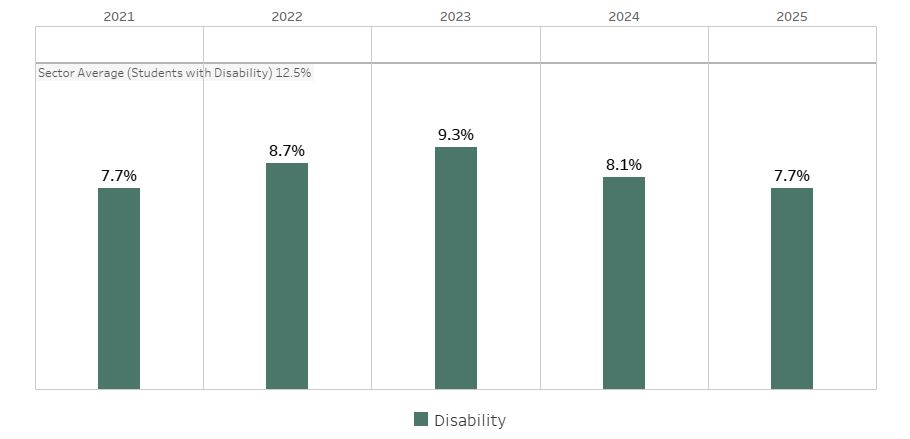
2024 Sector Average (Students with Disability): 12.5%
The Headcount by Student First Nations Status chart shows the yearly count of domestic undergraduate First Nations students as a proportion of domestic undergraduate students.
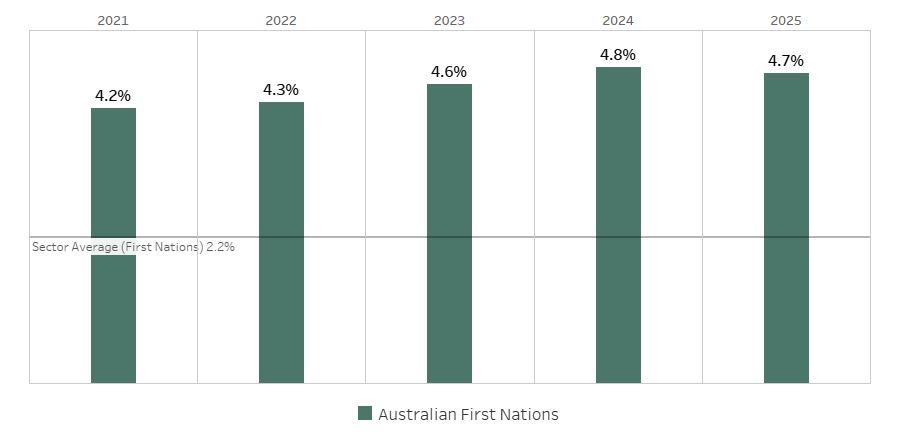
2024 Sector Average (First Nations): 2.2%
The Headcount by Student Socio-Economic Status (SES) chart shows the yearly proportion of domestic undergraduate students classified as Low SES, Medium SES, or High SES. Our SES data, based on postcode information, provides valuable insights but does not fully capture the number of Low SES students as accurately as the government’s street-level methodology. As a result, this chart uses national headcount data to demonstrate the University's Low SES cohort using the same methodology.
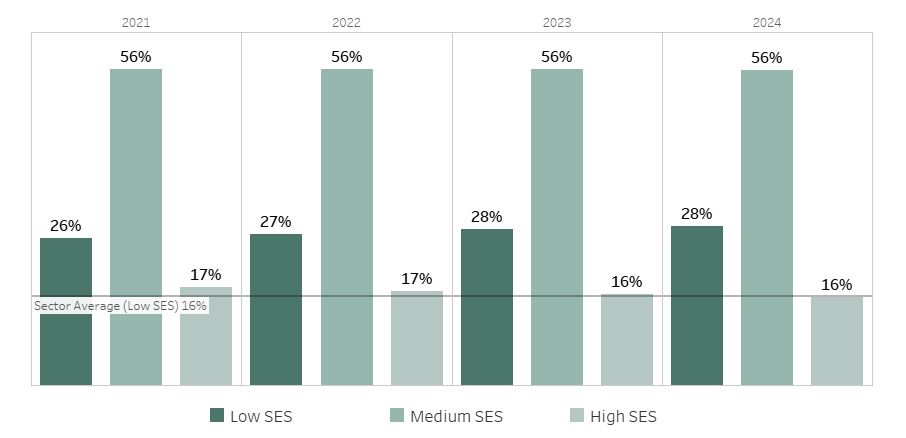
2024 Sector Average (Low SES): 16%
The Headcount by Student Location chart shows the yearly proportion of domestic undergraduate students in Regional/Remote Locations or Major Cities of Australia. Location information is based on the student's reported residential address.
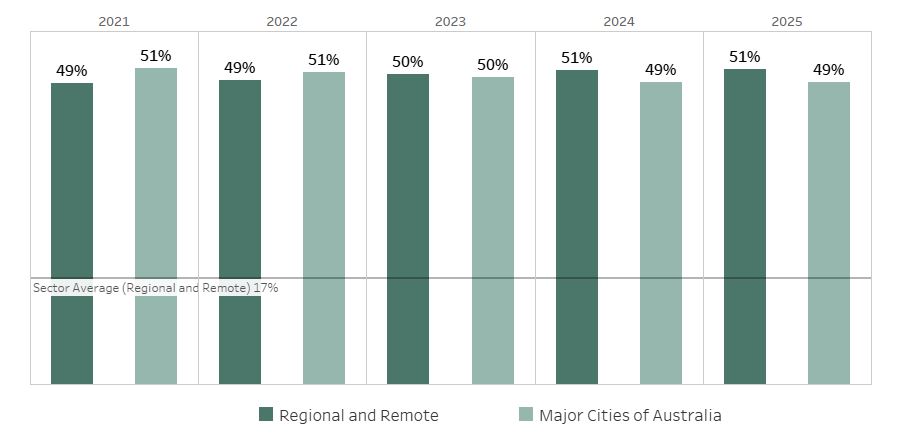
2024 Sector Average (Regional and Remote): 17%
The Headcount by Student Disability Status chart shows the yearly proportion of domestic undergraduate students with a reported disability.
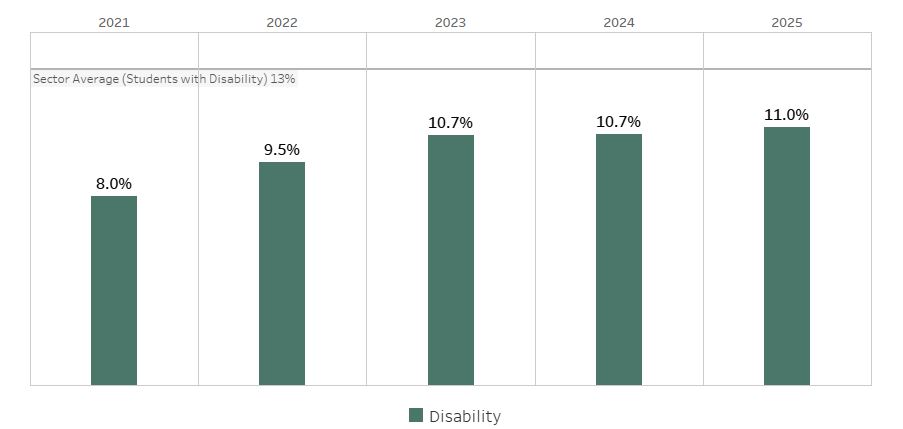
2024 Sector Average (Students with Disability): 13%
The Completions by Student First Nations Status chart shows the yearly count of domestic undergraduate First Nations completions as a proportion of domestic undergraduate completions.
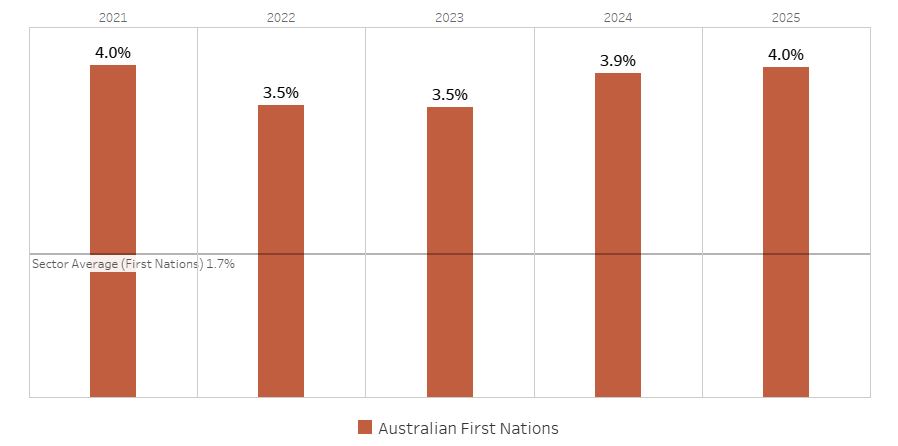
2024 Sector Average (First Nations): 1.7%
The Completions by Student Socio-Economic Status (SES) chart shows the yearly proportion of domestic undergraduate students classified as Low SES, Medium SES, or High SES. Our SES data, based on postcode information, provides valuable insights but does not fully capture the number of Low SES students as accurately as the government’s street-level methodology. As a result, this chart currently underrepresents the true number of Low SES students.
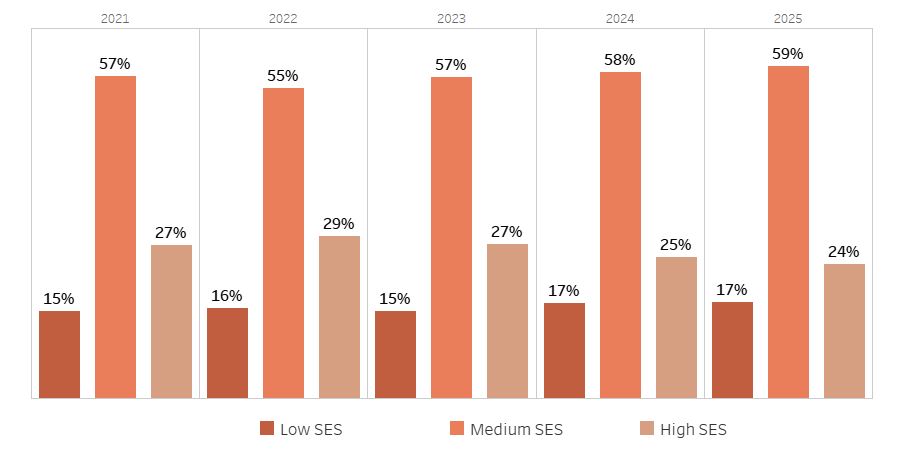
Comparable Data for Sector Average Not Available for SES
The Completions by Student Location chart shows the yearly proportion of domestic undergraduate student completions in Regional/Remote Locations or Major Cities of Australia. Location information is based on the student's reported residential address.
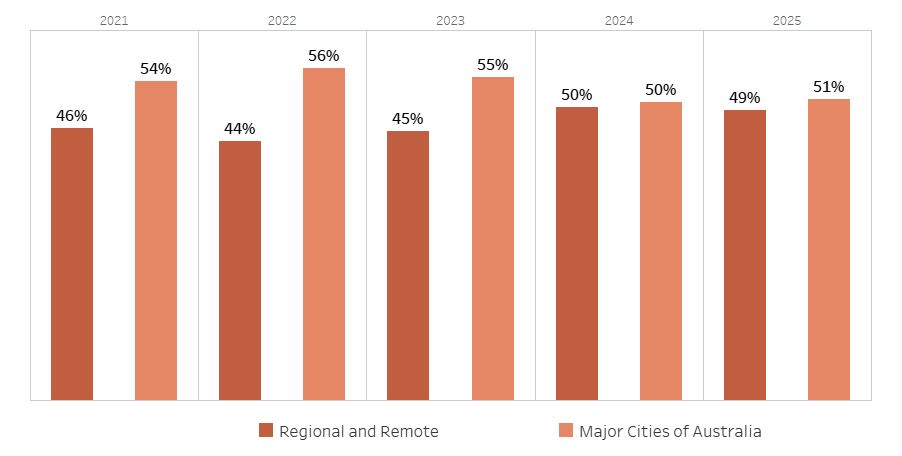
Comparable Data for Sector Average Not Available for Student Location
The Completions by Student Disability Status chart shows the yearly proportion of domestic undergraduate student completions with a reported disability.
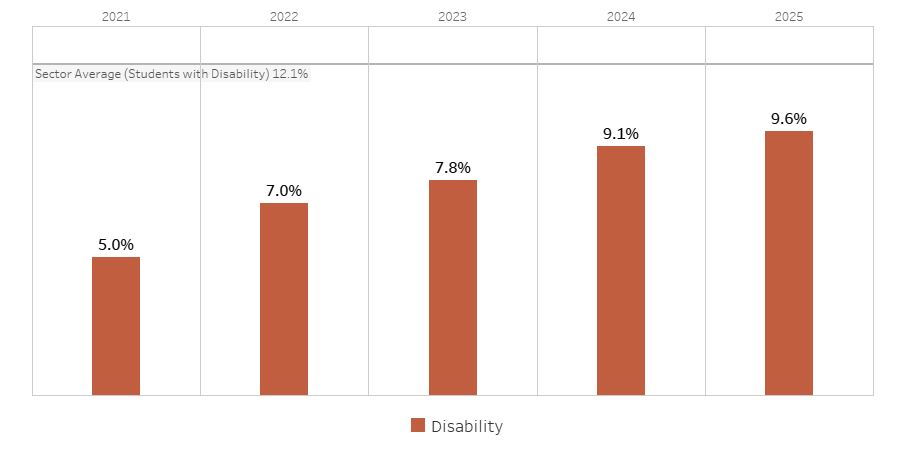
2024 Sector Average (Students with Disability): 12.1%
Staff seeking information on equity students for Needs-Based Funding purposes should contact the Office of Planning and Analytics.